The Ultimate Guide to Website Uptime Monitoring.
Why every second counts in modern web infrastructure, and how to build a robust checking strategy to protect your business.
Bimal Rai
Infrastructure Engineer
In the modern digital economy, availability isn’t just a metric — it’s the cornerstone of user trust. Whether you run a high-traffic e-commerce storefront, a SaaS dashboard, or a personal portfolio, every minute your site is down translates directly into lost revenue, frustrated customers, and diminished search engine authority.
Despite best efforts in automated testing and continuous integration, systems fail. Third-party APIs experience outages, DNS servers misbehave, database connections hit their thresholds, and certificates expire silently. This guide explains how to establish a robust website monitoring framework to catch these issues before your users do.
1. Understanding Check Types: HTTP vs. Ping
Not all downtime looks the same. To monitor effectively, you need to understand the tools at your disposal:
- HTTP/HTTPS Monitoring: The gold standard for web applications. These checks simulate a user browser making an actual request. A robust HTTP monitor validates the status code (expecting a 2xx or 3xx), responses headers, and can optionally check for specific text in the HTML body to ensure the database did not fail to load content.
- Ping (ICMP) Monitoring: Sends small echo requests to check if the server is powered on and connected to the network. While useful for bare-metal servers, ping checks cannot verify if your web server (like Nginx, Apache, or Node.js) is actually running or throwing 500 errors.
- Port Probing: Connects directly to specific ports (e.g., port 3306 for MySQL, 5432 for PostgreSQL, or 22 for SSH) to ensure custom services are responsive.
2. The Importance of Multi-Region Verification
A common pitfall of naive monitoring scripts is false alarms. If your monitor is hosted in a single data center in New York, and that data center experiences a brief network hiccup, it might report that your website in London is down, triggering emergency notifications in the middle of the night.
Enterprise monitoring systems use multi-region check networks. When a node detects a failure, it immediately requests verification from secondary servers in other geographies (e.g., Amsterdam, Singapore, Frankfurt). A down alert is only fired once a consensus is reached, preventing alert fatigue and saving engineering sanity.
3. How to Set Up an Optimal Alert Pipeline
Getting notified of an outage is critical, but getting notified correctly is an art. Follow these rules for a high-functioning alert flow:
- Incorporate Smart Retries: Do not fire an alert on the first failed request. A minor network congestion or DNS timeout can resolve itself in seconds. Checkers should retry up to 2 times with a short backoff (e.g., 5 seconds) before confirming a DOWN state.
- Segment by Severity: Minor tools or test environments should send notifications to email or Slack. Production outages must trigger high-priority alerts via SMS, phone calls, or PagerDuty.
- Automate Incident Logs: Integrate your monitor with a status page. When a monitor status changes, it should automatically create an incident record, keeping users updated without requiring manual intervention during a crisis.
Did you know?
Google’s Search Relations team has confirmed that while brief downtime (under a few hours) has negligible long-term impact on SEO, persistent downtime extending past 24 hours will cause Googlebot to scale back crawling, ultimately de-indexing key pages.
4. Beyond Uptime: Latency and Response-Time Spikes
Uptime is a binary metric, but user experience is a spectrum. A website that takes 15 seconds to load is technically "UP", but to your customers, it feels broken.
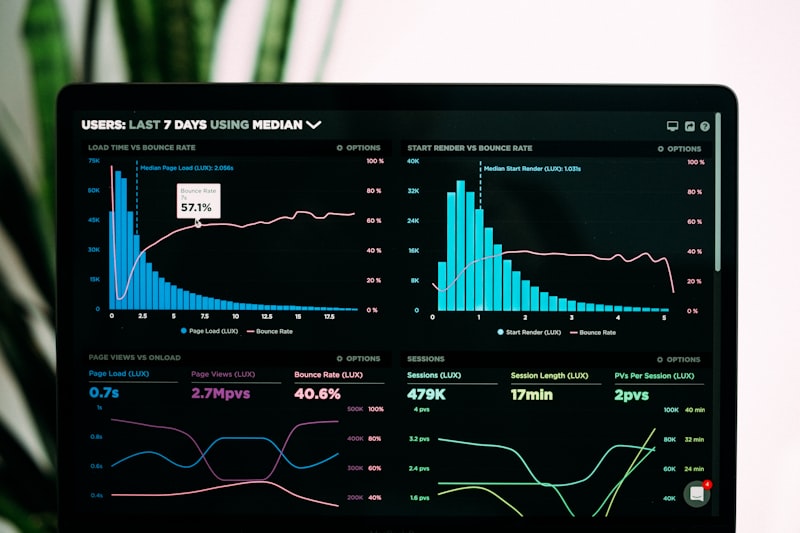
Your monitoring strategy must track Response Time (RTT) trends. Spikes in RTT indicate database lockups, memory leaks, or CDN misconfigurations. By visualizing latency curves over time, you can spot infrastructure bottlenecks and resolve them before they cause full-fledged downtime.
Ready to get started? Try our free HTTP Status Check tool or sign up for a free monitor to start guarding your uptime today.